Robinhood Chain Analytics: The Five Dashboards Worth Bookmarking
TVL, DEX volume, launch activity and wallet PnL — where each number actually lives.
The short answer
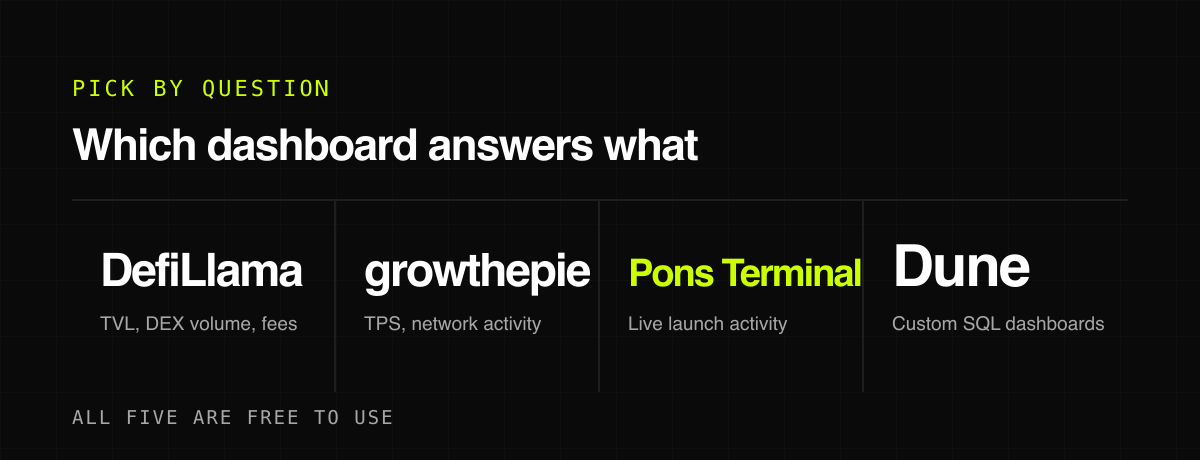
Robinhood Chain analytics split by question. DefiLlama covers chain TVL, DEX volume, fees and protocol share. growthepie covers network-level activity — TPS, fees, stablecoin supply and application usage. State of Blocks' Pons Terminal tracks launch activity in real time. Dune hosts community SQL dashboards for anything bespoke. For wallet-level performance rather than chain-level aggregates, Nock Scout and StalkChain rank public wallets by PnL and win rate. All five are free.
Most people open one analytics site and try to make it answer every question. On Robinhood Chain that fails quickly, because chain-level aggregates and trader-level data live in completely different places. Here is the split.
DefiLlama — the neutral scoreboard
The dedicated chain page covers TVL, stablecoin market cap, chain fees and revenue, DEX volume, perps volume, app fees and revenue, bridged TVL, transactions, net inflows and the full protocol list. A separate RWA page tracks active market cap and on-chain market cap for the tokenized-asset side, which is the metric that actually distinguishes this chain.
Use it to answer: how big is this chain, where is the money, and is that protocol's TVL real.
growthepie — network health
A metrics dashboard for the chain's network activity in real time: transactions per second, fees, stablecoin supply, application-level activity and historical trends. This is the layer DefiLlama does not cover — usage rather than capital.
Pons Terminal — launch activity
Hosted on State of Blocks, this dashboard tracks PONS launches and Robinhood Chain launch activity in real time. On a chain where the launchpad layer produces thousands of tokens, an aggregate TVL figure tells you nothing about what is happening at the launch layer. This does.
Dune — everything bespoke
Community SQL dashboards covering on-chain activity, trader cohorts and protocol usage. The value is that if a question has not been answered by a purpose-built tool, someone has usually written a query for it — and if not, you can.
Wallet-level: Nock Scout and StalkChain
Chain dashboards tell you what happened. Wallet tools tell you who made money doing it.
- Nock Scout — a public wallet leaderboard with estimated PnL, win rate, trade count and a follower simulation that models how a 1–3 ETH copier would have performed.
- StalkChain — seven free tools including Launch Radar, Memecoin Leaderboard, Fresh Wallet Feed, Whale Accumulation, Stock Flow Radar, Stock Premium Tracker and an Adoption Tracker.
The data layer underneath
If you are building rather than browsing: Bitquery offers low-latency streams for chain 4663, Goldsky has indexed the chain since launch — Uniswap, Privy, Rainbow, LI.FI, Bubblemaps and Gamma all pull data through it — and Allium and Entropy Advisors provide institutional-grade coverage. Arkham adds entity labelling and large-transfer alerts on top.
A practical routine
- Weekly: DefiLlama chain page, to see whether capital is arriving or leaving.
- Daily if you trade launches: Pons Terminal and a launch radar.
- Before any copytrade: Nock Scout or StalkChain on the specific wallet.
- When something looks wrong: Blockscout, then Arkham for attribution.
The numbers that mislead
Every dashboard on this list is honest about what it measures. The misreading happens at the interpretation layer, and three metrics cause most of it.
- TVL measures capital parked, not capital at work. A chain can grow TVL on a single incentivised deposit and lose it the day the incentive ends.
- DEX volume includes wash trading, and on a chain with near-free gas that share is not trivial. Volume growing without holder or address growth is a signal in itself.
- Active addresses counts addresses, not people. Airdrop farming inflates it structurally, and there is no clean way to filter that from the outside.
The defence is to read metrics in pairs. Volume against unique traders. TVL against protocol revenue. Transactions against fees paid. When two related numbers diverge, the divergence is the story.
Building a weekly read that takes ten minutes
- Open the chain page and note TVL and its weekly change — is capital arriving or leaving?
- Check protocol share. Has anything moved into or out of the top five?
- Check DEX volume against the previous week, and against active addresses. Both rising is healthy; volume alone is not.
- Check chain fees and revenue. Fees are the closest thing to an honest usage signal, because nobody pays them for show.
- Note anything new in the top twenty protocols. That list is where the next thing appears before it appears anywhere else.
Ten minutes a week on that routine will tell you more about whether this chain is working than any amount of timeline reading.
 PONS
PONS Nock Scout
 StalkChain
 Bubblemaps
 Uniswap
 Goldsky
 Arkham
 Pons Terminal
FAQ
Where can I see Robinhood Chain TVL?
DefiLlama's dedicated chain page. It also breaks out DEX volume, perps volume, chain fees and revenue, and the full protocol list, plus a separate RWA page for tokenized-asset metrics.
Is there a free Robinhood Chain analytics tool?
Several. DefiLlama, growthepie, Dune, Pons Terminal on State of Blocks, Nock Scout and StalkChain are all free. Blockscout's stats page is free as well.
How do I track whale wallets on Robinhood Chain?
Arkham supports the chain with entity labels, large-transfer alerts and a node-based fund-flow Visualizer. For trader-level PnL rather than entity identity, use Nock Scout or StalkChain's Whale Accumulation tool.
Is there an API for Robinhood Chain data?
Yes. Bitquery provides low-latency streams for chain ID 4663, and Goldsky has indexed the chain since launch and is used across the ecosystem.
More from the blog
How to Find a Wallet Worth Copying on Robinhood Chain
Leaderboards rank by total profit, which is mostly size and luck. Five checks that separate a repeatable edge from one lucky position.
Is Copytrading Profitable? The Arithmetic Nobody Runs First
Copytrading pays you the leader's return minus four deductions. Here is what each one costs, and the win rate a wallet needs before following it makes money.
Copytrading vs Trading Yourself: Which Actually Suits You
One rents someone else's research at a fixed price. The other charges you in time instead of fees. The honest comparison on cost, control and what you learn.